Computer Vision That Measures Road-Line Wear From Dashcam Video
Nexora engineers took over an AI system that measures road-line paint wear from dashcam video, then rebuilt its evaluation and delivery to Japanese acceptance standards.
Computer Vision That Measures Road-Line Wear From Dashcam Video
Kết quả
The Challenge
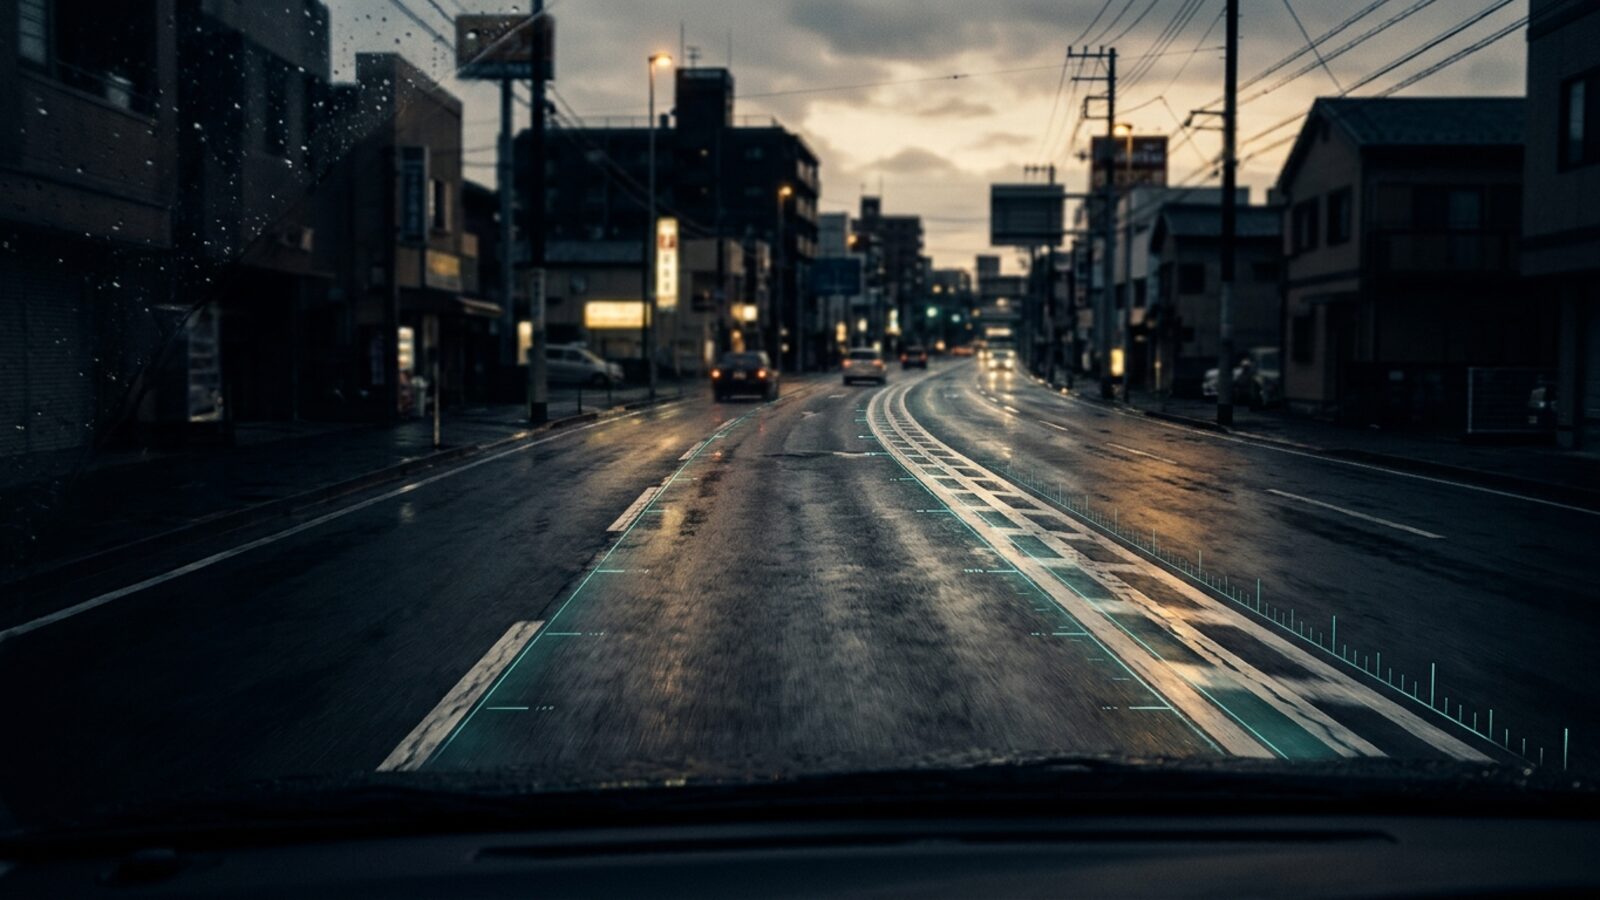
A Japanese software company in the transport infrastructure field needs to measure how much road-line paint has worn away, using video from vehicle-mounted cameras instead of manual surveys. The camera works in uncontrolled conditions: changing light, different angles and lens quality that varies between smartphones and dedicated cameras. The model has to segment the paint pixel by pixel, and those pixels then have to become a number the customer can trust. A plausible-looking but wrong number is the main risk.
What Nexora Took On
Nexora engineers took the system over from a previous vendor and work on the AI layer across data, training, inference, evaluation and handover. The team works within the repository and review process of the project and delivers to the acceptance standards set by the Japanese side. Handover documentation and the on-screen display are in Japanese. The input is one raw video, and the output is an overlay video, per-frame measurements in JSON and CSV and a SHA-256 provenance record.

The Inference Pipeline
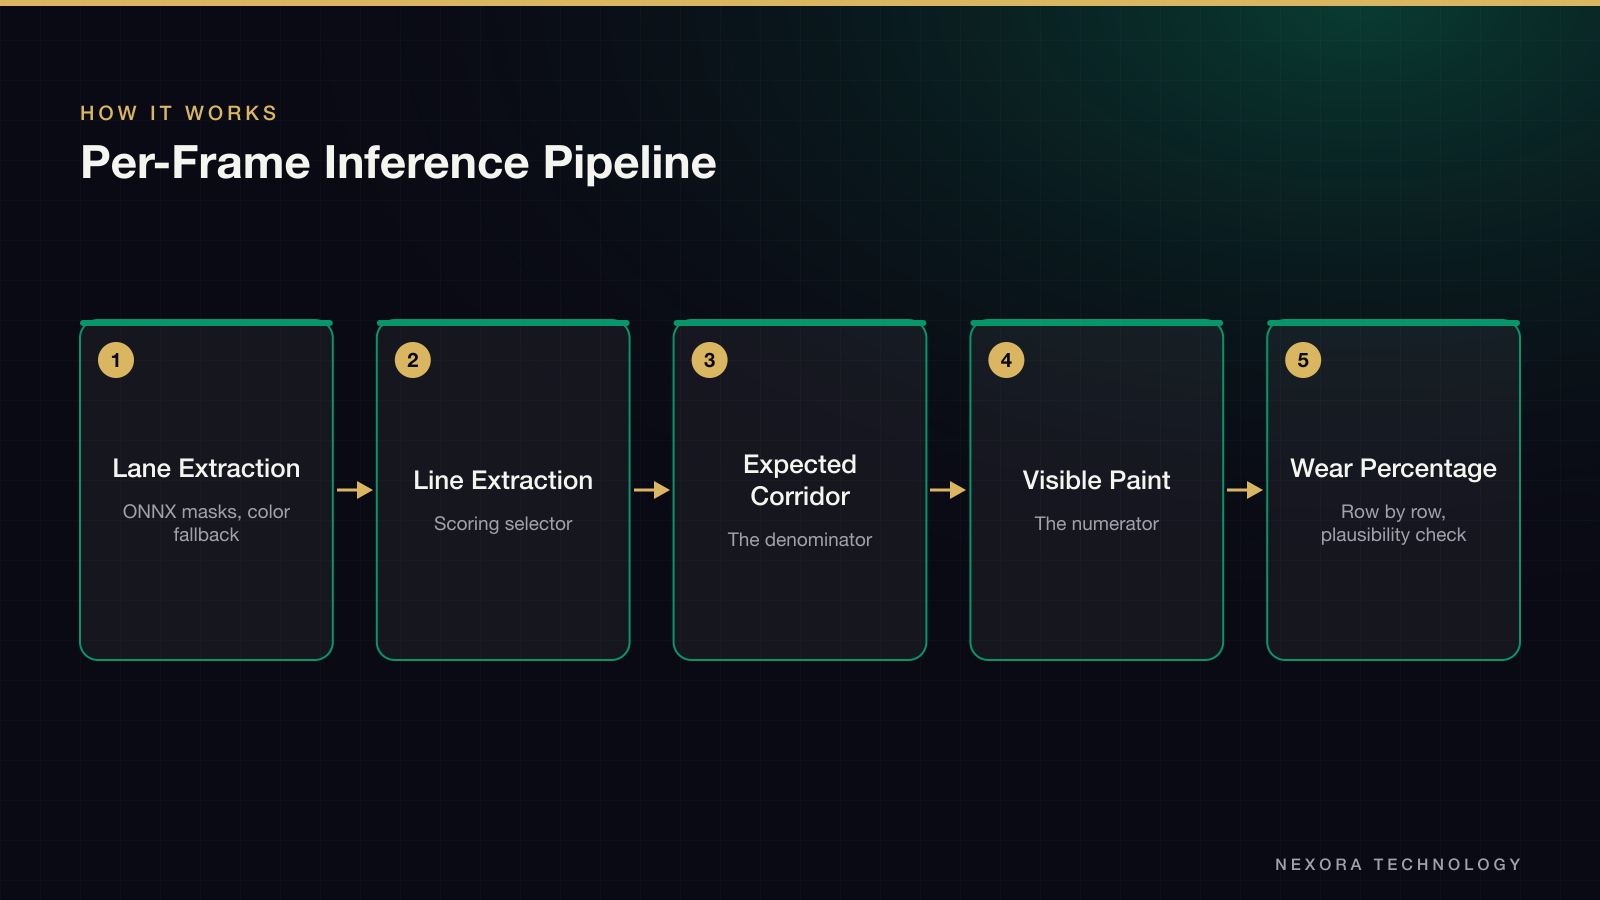
The pipeline runs per frame in five config-driven stages built as plugins, so any stage can be replaced or upgraded without touching the others. State resets on every frame on purpose, to prevent cross-frame contamination. The model combines AI segmentation with classical HSV and Hough processing as a safety net.
- Lane extraction: an ONNX model produces five binary masks, with a color-based fallback
- Line extraction: several extractors feed a scoring selector that picks one final line per role
- Expected corridor: the denominator of the measurement, with dashed lines rebuilt from a hull around each stroke so designed gaps are not counted as wear
- Visible paint: the numerator, taken from pixels that actually show paint
- Wear percentage: measured row by row, with a bird’s-eye projection as a plausibility check
Training and Data
The data loop runs on a self-hosted CVAT instance with the customer’s annotators. Nexora defined labeling criteria for classes that are hard to tell apart by eye and agreed how to exclude images that cannot be identified. The dataset holds about 12,600 training images and 500 validation images across 5 classes. The model is an EfficientNet-B3 with BiFPN and five binary segmentation heads, trained on the customer’s GPU server with class-weighted loss to handle rare classes, then exported to ONNX to run on CPU in a deployment without a GPU.
Measure First, Then Improve
When the team took over the system it did not start by editing code. It built an evaluation harness first, scoring IoU and F1 per class on the 500 validation images and exporting overlay images next to every number. With a ruler in place, it found a mismatch between training and deployment: training resized images directly while inference used letterboxing. This kind of bug causes no crash and silently drags accuracy down. A controlled A/B test on the same model showed that fixing one preprocessing step lifted IoU by 2.9 to 6.5 points on every class, with no retraining. The customer can reproduce every conclusion from the delivered scripts.
Delivery to a Japanese Standard
Japanese customers judge a partner by the quality of the first handover: whether results can be reproduced, whether limits are stated and whether problems are raised before anyone asks. Three mechanisms guard against silent errors. When there are too few measurable rows or pixels, or the bird’s-eye support is too low, the system returns UNAVAILABLE instead of a number. A strict config schema rejects unknown keys at load time, so a typo can never turn into a quiet default. And each line class gets its own threshold, since faint and dashed lines have different signal distributions from solid ones.
- Raw per-frame data (IoU, F1, precision, recall, TP, FP, FN) in long-format CSV, with a fixed taxonomy for every failure reason
- Every report records its inputs, thresholds, sample counts, exclusions and run timestamp, and every chart comes from a saved script
- Overlay images for each claim, with the IoU printed on the image
- Versioned data contracts and a checksum on every delivered file; misspelled file names that downstream systems depend on are left alone
Results
The customer has a system that runs on CPU without a GPU, produces reproducible numbers and refuses to answer when evidence is thin. Every change is checked with a four-run matrix of old code and new code against annotated and unannotated image sets, with model and thresholds held fixed. The handover also states plainly what the numbers should and should not be used for.
Bạn có một dự án tương tự?
Kể cho chúng tôi nghe. Cuộc tư vấn đầu tiên miễn phí.